exam1data;
score=sum(p,2);
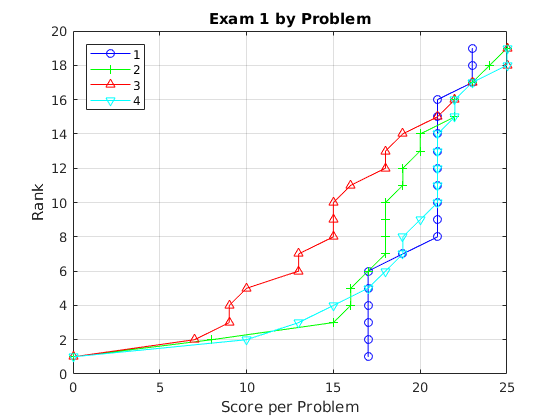
figure;plot(sort(p(:,1)),1:size(p,1),'b-o',...
sort(p(:,2)),1:size(p,1),'g-+',...
sort(p(:,3)),1:size(p,1),'r-^',...
sort(p(:,4)),1:size(p,1),'c-v'...
);grid on;
legend('1','2','3','4','Location','NorthWest');
xlabel('Score per Problem');ylabel('Rank');
title('Exam 1 by Problem');
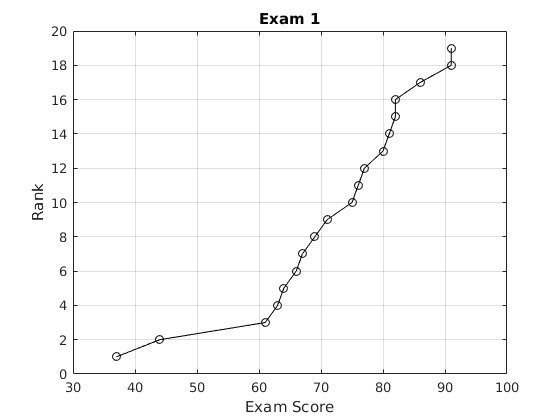
figure;plot(sort(score),1:size(score,1),'k-o');grid on;
xlabel('Exam Score');ylabel('Rank');
title('Exam 1');
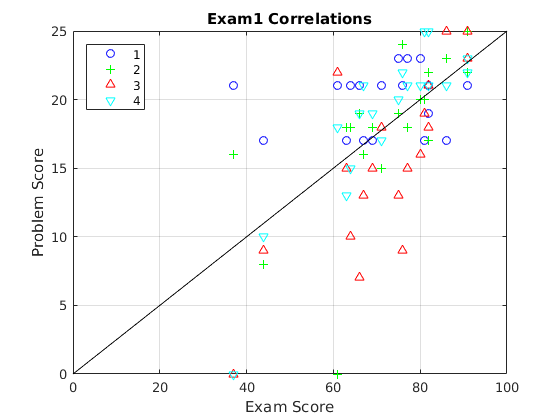
figure;plot(score,p(:,1),'bo',...
score,p(:,2),'g+',...
score,p(:,3),'r^',...
score,p(:,4),'cv',...
[0,100],[0,25],'k-');grid on;
legend('1','2','3','4','Location','NorthWest');
xlabel('Exam Score');ylabel('Problem Score');
title('Exam1 Correlations');