f=10.^[-2:0.1:5];
omega=2*pi*f;
RL=500;R1=50;L=2;C=200e-6;
Z2=par(RL+1j*omega*L,1./(1j*omega*C));
Av_C=Z2./(R1+Z2);
Av=Av_C.*RL./(RL+1j*omega*L);
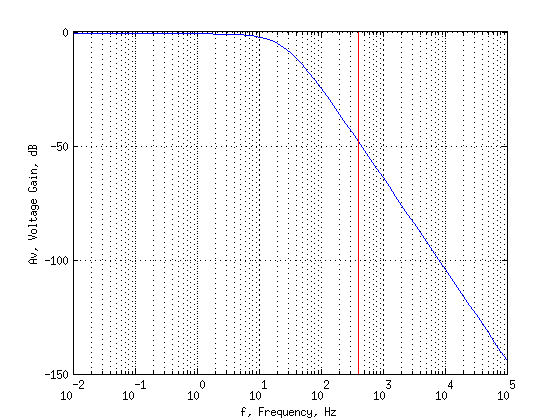
h1=figure;semilogx(f,20*log10(abs(Av)));grid on;
xlabel('f, Frequency, Hz');ylabel('Av, Voltage Gain, dB');
moose=axis;
hold on;semilogx(400*[1,1],moose(3:4),'r');hold off;
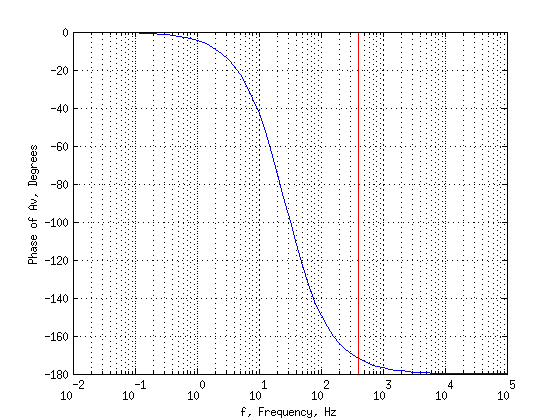
h2=figure;semilogx(f,180/pi*angle(Av));grid on;
xlabel('f, Frequency, Hz');ylabel('Phase of Av, Degrees');
moose=axis;
hold on;semilogx(400*[1,1],moose(3:4),'r');hold off;
Av1=Av(1)
findmyfrequency=find(f>400,1)
f48=f(48)
f47=f(47)
Av47=Av(47)
amplitude47=abs(Av(47))
angle47deg=180/pi*angle(Av(47))
figure(h1);print -djpeg w1-1.jpg
figure(h2);print -djpeg w1-2.jpg
Av1 =
   0.9091 - 0.0007i
findmyfrequency =
    48
f48 =
  501.1872
f47 =
  398.1072
Av47 =
  -0.0039 - 0.0006i
amplitude47 =
    0.0040
angle47deg =
 -172.0000