Contents
npts=2^16;timespan=1e-2;
t=[0:npts-1]*timespan/npts;
dt=t(2)-t(1)
fsample=1/dt
f=2^3/timespan;
omega=2*pi*f;
dt =
   1.5259e-07
fsample =
     6553600
Square Wave
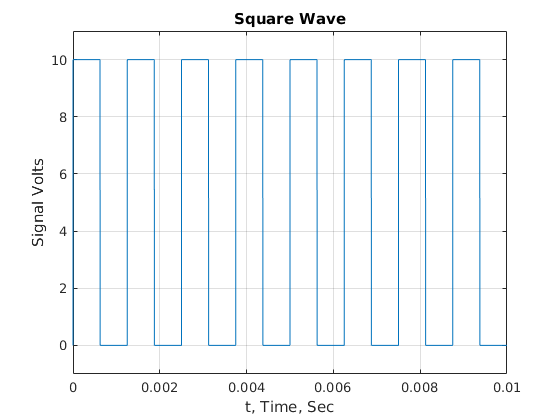
square=10*double(sin(omega*t)>0);
fdisplay=12*f;
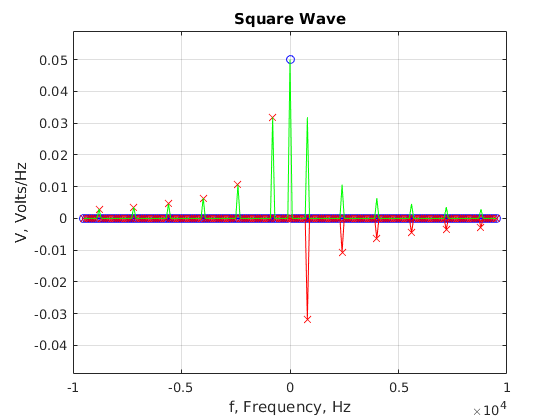
[pt,pf,fax,SQUARE]=plotpair(t,square,fdisplay);
figure(pt);xlabel('t, Time, Sec');title('Square Wave');
figure(pf);xlabel('f, Frequency, Hz');title('Square Wave');
How much does it look like DC?
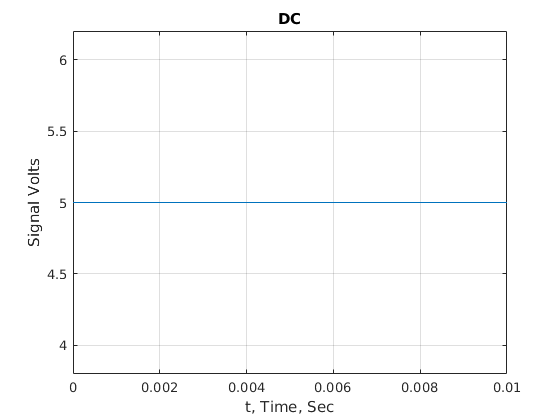
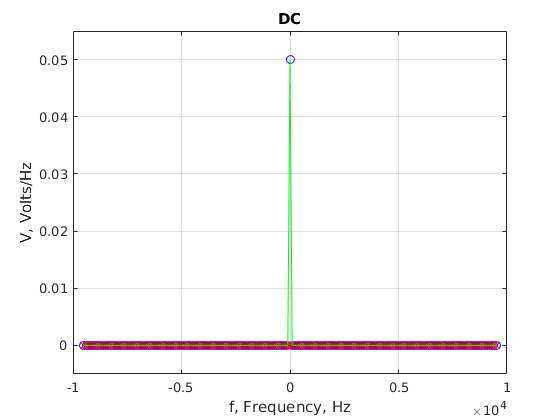
term0=5*ones(size(square));
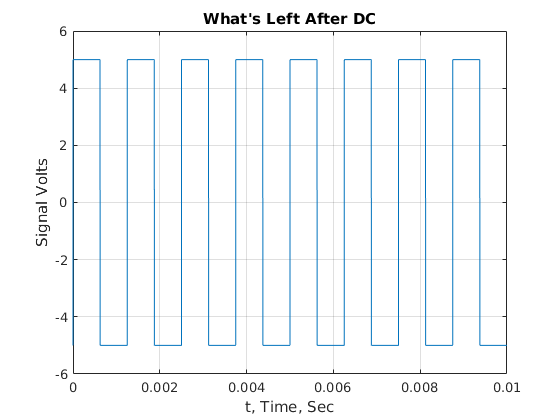
s0=square-term0;
[pt,pf,fax,TERM0]=plotpair(t,term0,fdisplay);
figure(pt);xlabel('t, Time, Sec');title('DC');
figure(pf);xlabel('f, Frequency, Hz');title('DC');
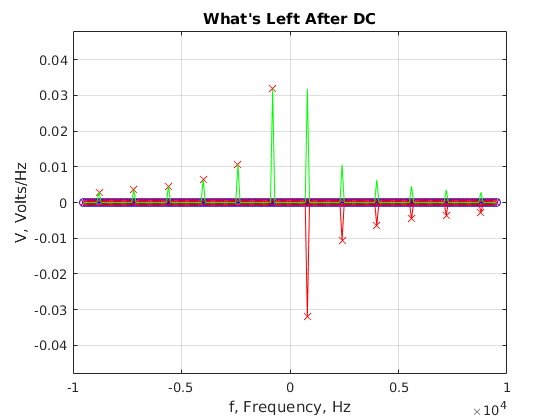
[pt,pf,fax,S0]=plotpair(t,s0,fdisplay);
figure(pt);xlabel('t, Time, Sec');title('What''s Left After DC');
figure(pf);xlabel('f, Frequency, Hz');title('What''s Left After DC');
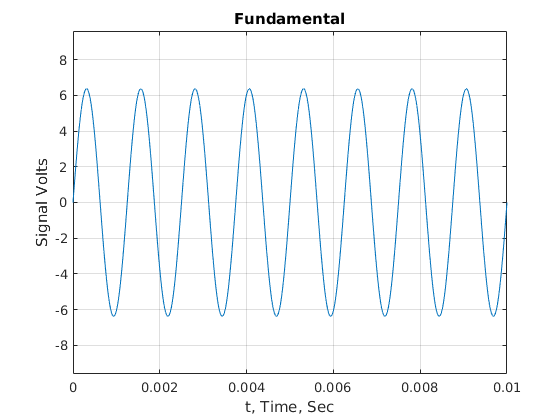
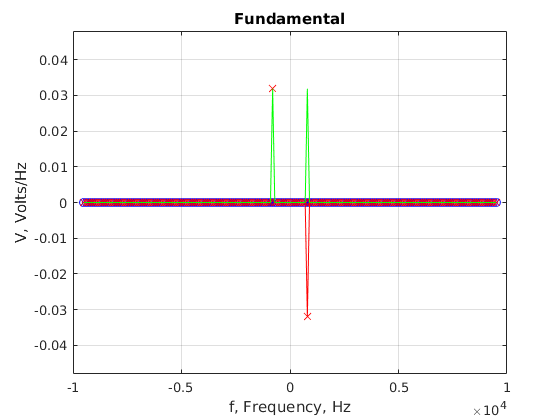
How much does it look like sin(omega*t)?
term1=5*sin(omega*t)*4/pi;
s1=s0-term1;
[pt,pf,fax,TERM1]=plotpair(t,term1,fdisplay);
figure(pt);xlabel('t, Time, Sec');title('Fundamental');
figure(pf);xlabel('f, Frequency, Hz');title('Fundamental');
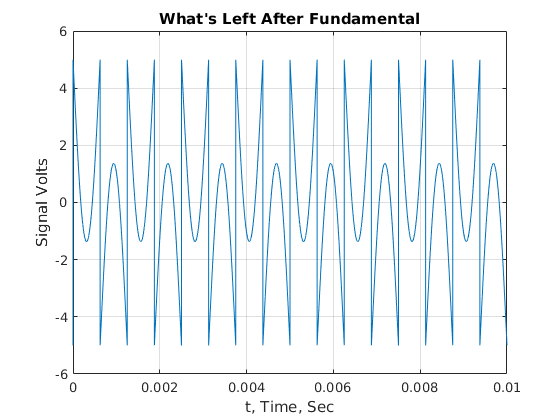
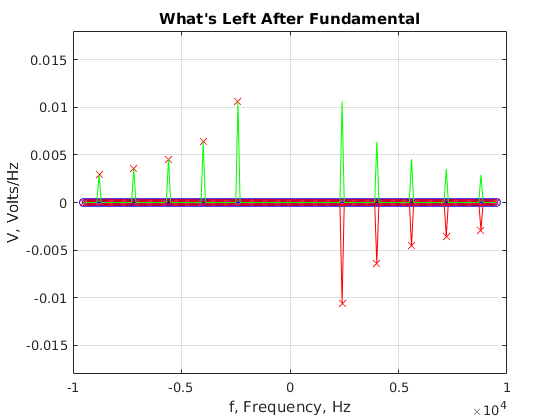
[pt,pf,fax,S1]=plotpair(t,s1,fdisplay);
figure(pt);xlabel('t, Time, Sec');title('What''s Left After Fundamental');
figure(pf);xlabel('f, Frequency, Hz');title('What''s Left After Fundamental');
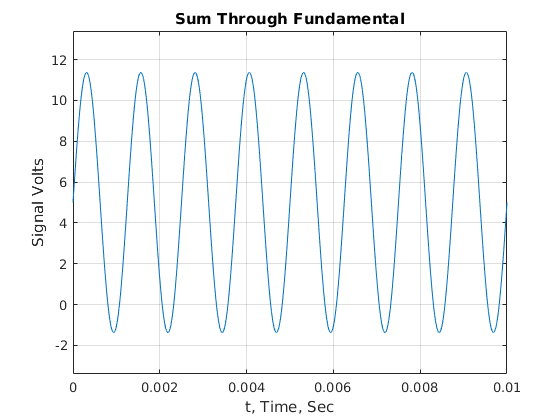
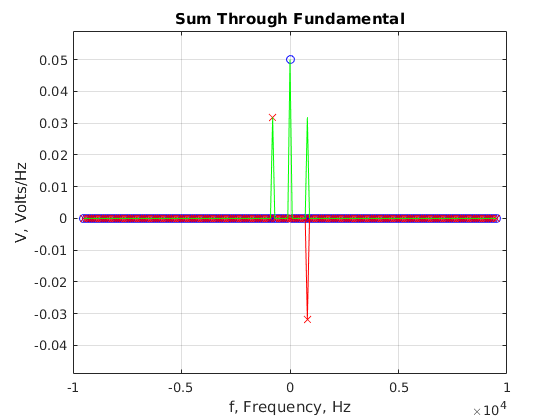
square1=term0+term1;
[pt,pf,fax,SQUARE1]=plotpair(t,square1,fdisplay);
figure(pt);xlabel('t, Time, Sec');title('Sum Through Fundamental');
figure(pf);xlabel('f, Frequency, Hz');title('Sum Through Fundamental');
How much does it look like sin(3*omega*t)?
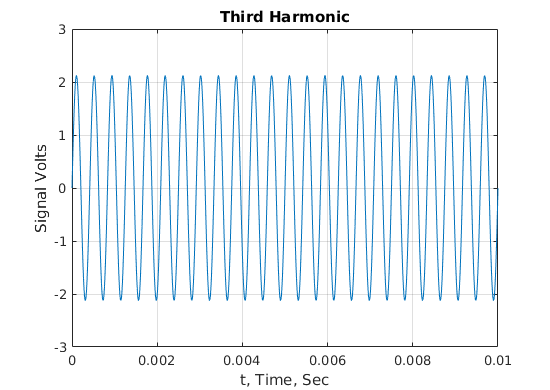
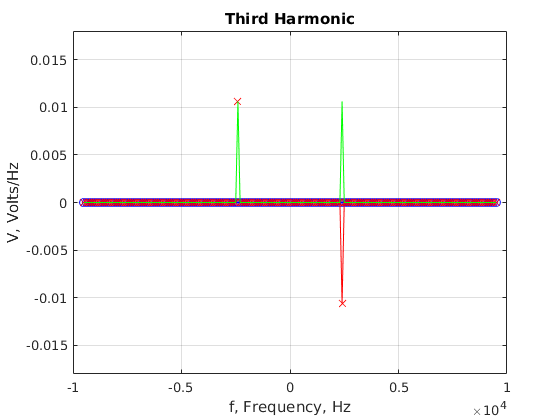
term3=5/3*sin(3*omega*t)*4/pi;
s3=s1-term3;
[pt,pf,fax,TERM3]=plotpair(t,term3,fdisplay);
figure(pt);xlabel('t, Time, Sec');title('Third Harmonic');
figure(pf);xlabel('f, Frequency, Hz');title('Third Harmonic');
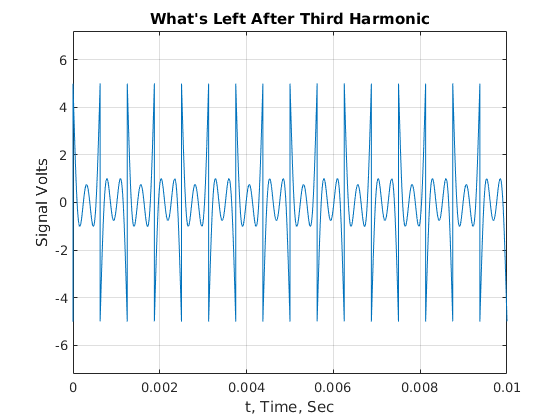
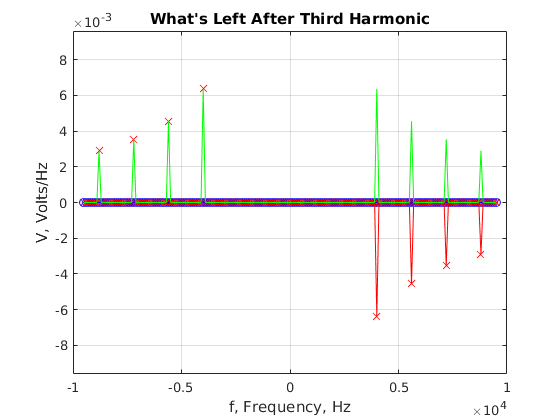
[pt,pf,fax,S3]=plotpair(t,s3,fdisplay);
figure(pt);xlabel('t, Time, Sec');title('What''s Left After Third Harmonic');
figure(pf);xlabel('f, Frequency, Hz');title('What''s Left After Third Harmonic');
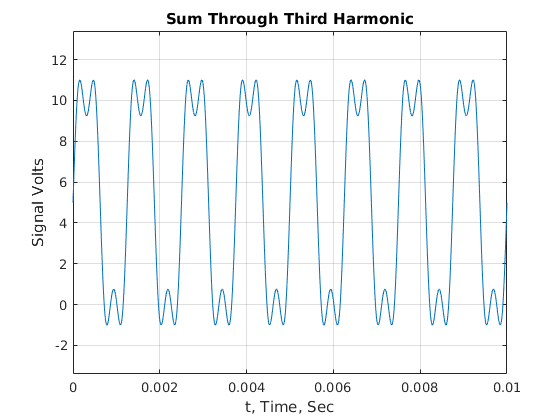
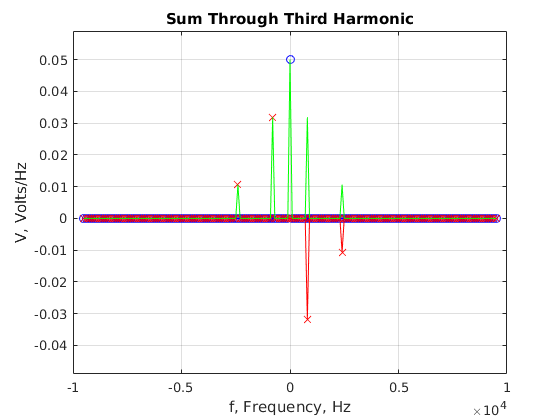
square3=term0+term1+term3;
[pt,pf,fax,SQUARE3]=plotpair(t,square3,fdisplay);
figure(pt);xlabel('t, Time, Sec');title('Sum Through Third Harmonic');
figure(pf);xlabel('f, Frequency, Hz');title('Sum Through Third Harmonic');
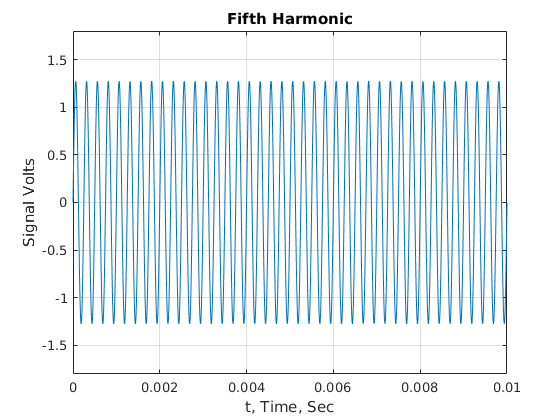
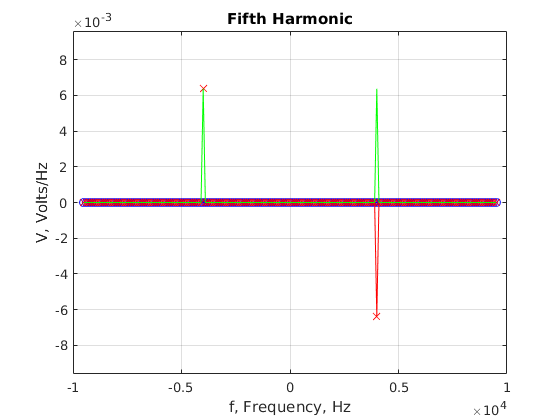
How much does it look like sin(5*omega*t)?
term5=5/5*sin(5*omega*t)*4/pi;
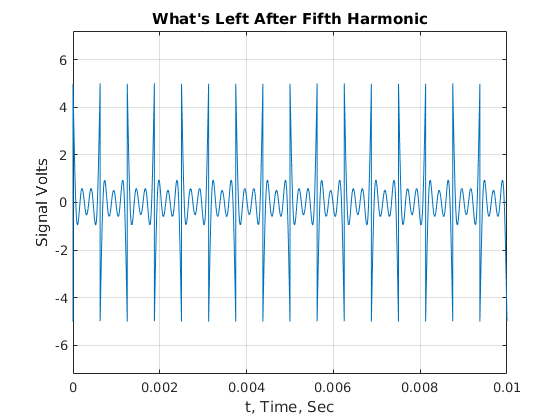
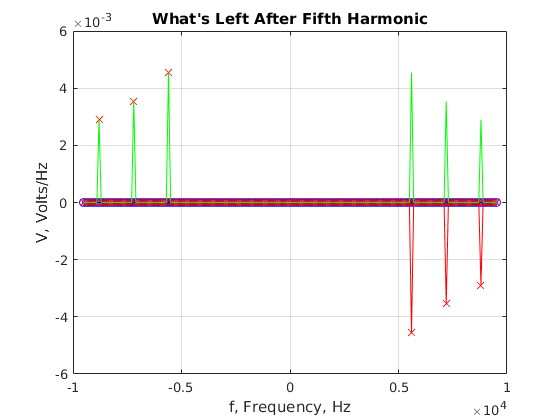
s5=s3-term5;
[pt,pf,fax,TERM5]=plotpair(t,term5,fdisplay);
figure(pt);xlabel('t, Time, Sec');title('Fifth Harmonic');
figure(pf);xlabel('f, Frequency, Hz');title('Fifth Harmonic');
[pt,pf,fax,S5]=plotpair(t,s5,fdisplay);
figure(pt);xlabel('t, Time, Sec');title('What''s Left After Fifth Harmonic');
figure(pf);xlabel('f, Frequency, Hz');title('What''s Left After Fifth Harmonic');
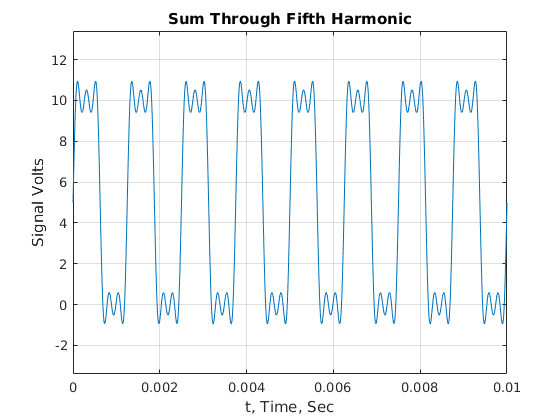
square5=term0+term1+term3+term5;
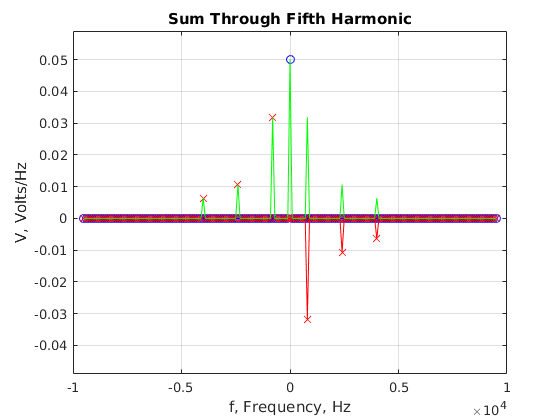
[pt,pf,fax,SQUARE5]=plotpair(t,square5,fdisplay);
figure(pt);xlabel('t, Time, Sec');title('Sum Through Fifth Harmonic');
figure(pf);xlabel('f, Frequency, Hz');title('Sum Through Fifth Harmonic');