Contents
% /home/dimarzio/Documents/working/12229/lectures/alias.m
% Sat Nov 11 14:19:11 2017
% Mon Nov 19 10:54:28 2018
% Chuck DiMarzio, Northeastern University
Setup
nptshi=2^16; % High Sample Frequency
thi=[0:nptshi-1]*10e-3/nptshi;  % Time axis
% Sampling Frequency
dthi=thi(2)-thi(1)
fsamplehi=1/dthi

nptslo=2^4; % Low Sample Frequency
tlo=[0:nptslo-1]*10e-3/nptslo;  % Time axis
% Sampling Frequency
dtlo=tlo(2)-tlo(1)
fsamplelo=1/dtlo
dthi =
   1.5259e-07
fsamplehi =
     6553600
dtlo =
   6.2500e-04
fsamplelo =
        1600
Generate the signal
Start with two sinusoidal waves
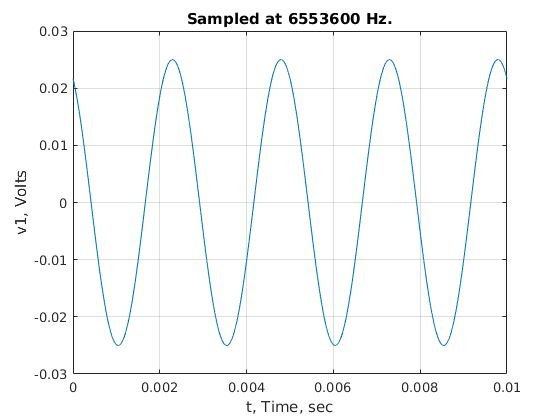
f1=400
omega1=2*pi*f1;
f2=1000
omega2=2*pi*f2;
vm1=0.025;phi1=30*pi/180;
vm2=0.05;phi2=65*pi/180;

v1hi=vm1*cos(omega1*thi+phi1);
v2hi=vm2*cos(omega2*thi+phi2);
vhi=v1hi+v2hi;

v1lo=vm1*cos(omega1*tlo+phi1);
v2lo=vm2*cos(omega2*tlo+phi2);
vlo=v1lo+v2lo;
f1 =
   400
f2 =
        1000
Plot v1
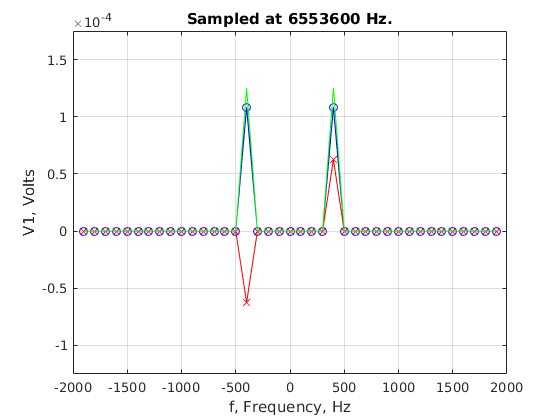
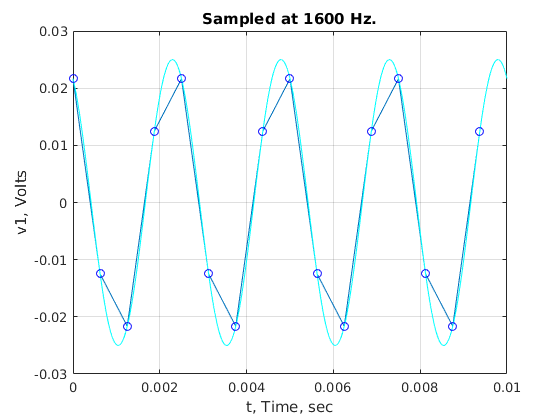
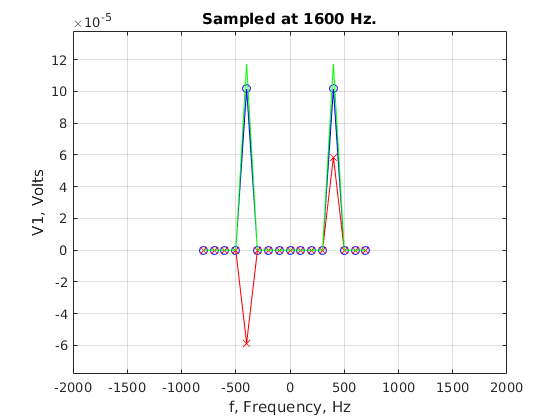
fdisplay=max(f1,f2)*2;
% High sample rate first
[pt,pf,fhi,V1HI]=plotpair(thi,v1hi,fdisplay);
figure(pt);xlabel('t, Time, sec');ylabel('v1, Volts');
title(['Sampled at ',num2str(fsamplehi),' Hz.']);
figure(pf);xlabel('f, Frequency, Hz');ylabel('V1, Volts');
title(['Sampled at ',num2str(fsamplehi),' Hz.']);
% Then low
[pt,pf,flo,V1LO]=plotpair(tlo,v1lo,fdisplay);
figure(pt);xlabel('t, Time, sec');ylabel('v1, Volts');
hold on;plot(thi,v1hi,'c');hold off;
hold on;plot(tlo,v1lo,'bo');hold off;
title(['Sampled at ',num2str(fsamplelo),' Hz.']);
figure(pf);xlabel('f, Frequency, Hz');ylabel('V1, Volts');
title(['Sampled at ',num2str(fsamplelo),' Hz.']);
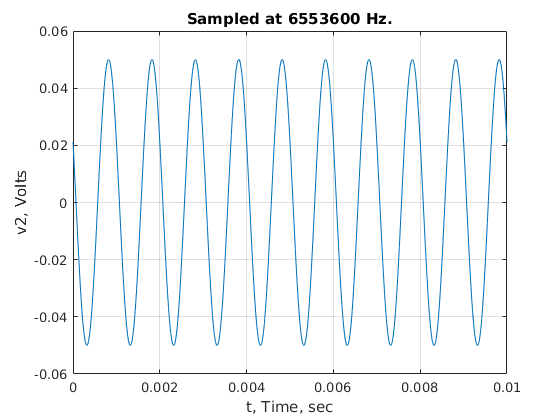
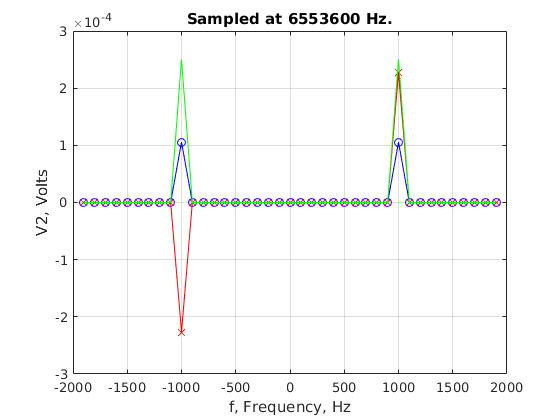
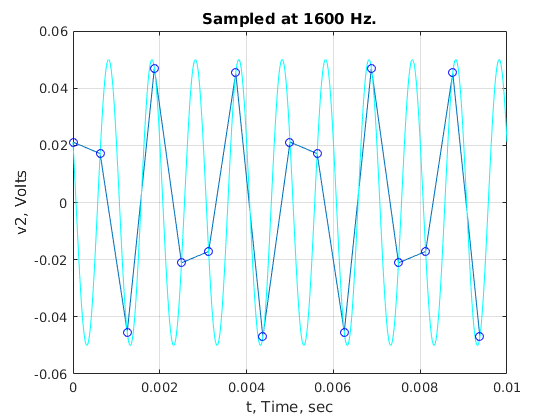
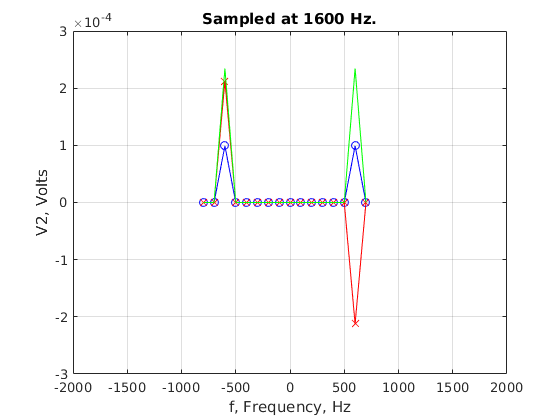
Plot v2
High sample rate first
[pt,pf,fhi,V2HI]=plotpair(thi,v2hi,fdisplay);
figure(pt);xlabel('t, Time, sec');ylabel('v2, Volts');
title(['Sampled at ',num2str(fsamplehi),' Hz.']);
figure(pf);xlabel('f, Frequency, Hz');ylabel('V2, Volts');
title(['Sampled at ',num2str(fsamplehi),' Hz.']);
% Then low
[pt,pf,flo,V2LO]=plotpair(tlo,v2lo,fdisplay);
figure(pt);xlabel('t, Time, sec');ylabel('v2, Volts');
hold on;plot(thi,v2hi,'c');hold off;
hold on;plot(tlo,v2lo,'bo');hold off;
title(['Sampled at ',num2str(fsamplelo),' Hz.']);
figure(pf);xlabel('f, Frequency, Hz');ylabel('V2, Volts');
title(['Sampled at ',num2str(fsamplelo),' Hz.']);
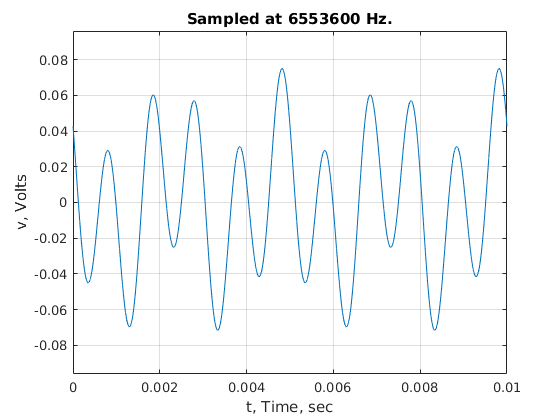
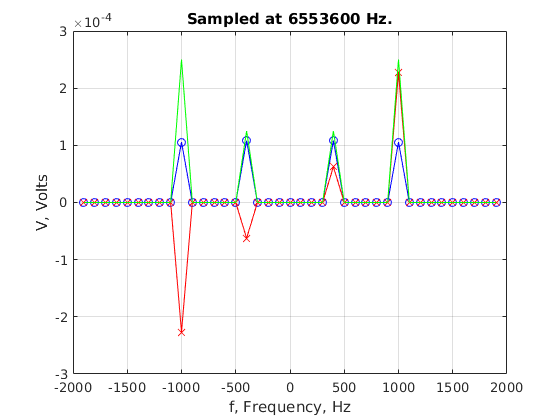
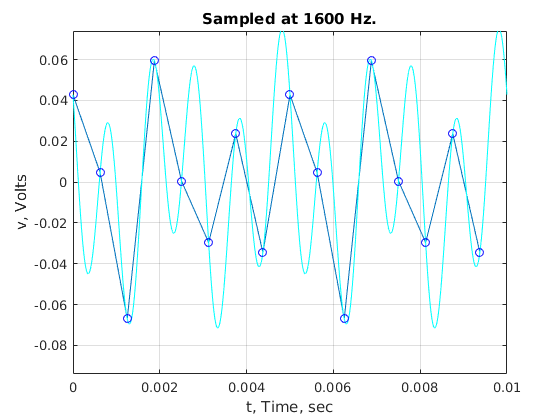
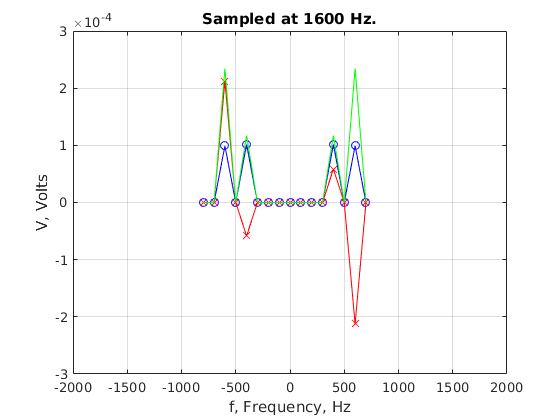
Plot v
High sample rate first
[pt,pf,fhi,VHI]=plotpair(thi,vhi,fdisplay);
figure(pt);xlabel('t, Time, sec');ylabel('v, Volts');
title(['Sampled at ',num2str(fsamplehi),' Hz.']);
figure(pf);xlabel('f, Frequency, Hz');ylabel('V, Volts');
title(['Sampled at ',num2str(fsamplehi),' Hz.']);
% Then low
[pt,pf,flo,VLO]=plotpair(tlo,vlo,fdisplay);
figure(pt);xlabel('t, Time, sec');ylabel('v, Volts');
hold on;plot(thi,vhi,'c');hold off;
hold on;plot(tlo,vlo,'bo');hold off;
title(['Sampled at ',num2str(fsamplelo),' Hz.']);
figure(pf);xlabel('f, Frequency, Hz');ylabel('V, Volts');
title(['Sampled at ',num2str(fsamplelo),' Hz.']);