Contents
% /home/dimarzio/Documents/working/12229/lectures/ftransform.m
% Sat Nov  4 14:39:30 2017
% Chuck DiMarzio, Northeastern University
%
Fourier transform
t=[1:4096]*10e-3/4096;  % Time axis
T=1024*10e-3/4096; % Period of a periodic function
f0=1/T
omega0=2*pi*f0;
% Sampling Frequency
dt=t(2)-t(1)
fsample=1/dt
f0 =
   400
dt =
   2.4414e-06
fsample =
      409600
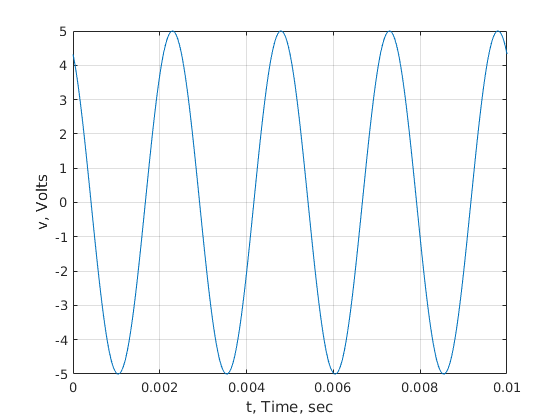
Start with a sinusoidal wave
vm=5;phi=30*pi/180;v=vm*cos(omega0*t+phi);
figure;plot(t,v);grid on;
xlabel('t, Time, sec');ylabel('v, Volts');
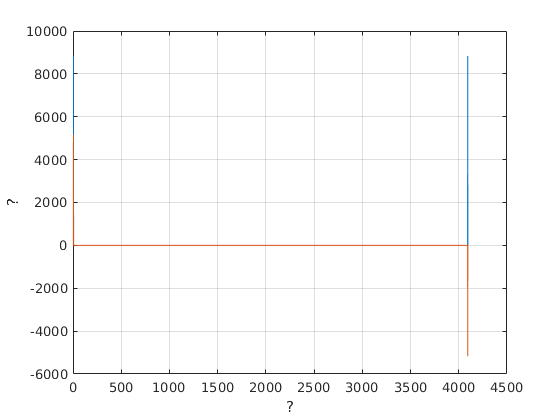
%  Fourier transform
V=fft(v);
figure;plot(1:length(t),real(V),1:length(t),imag(V));grid on;
xlabel('?');ylabel('?');
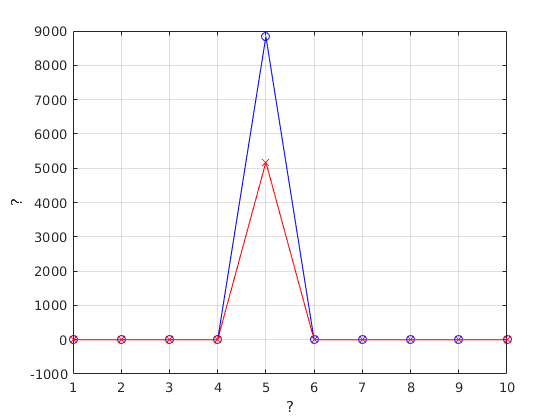
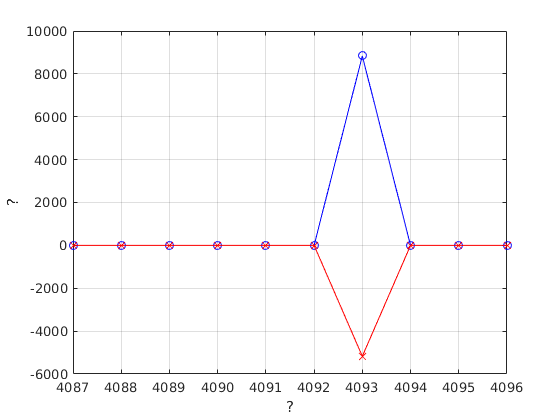
% Plot the first and last 10 points
figure;plot(1:10,real(V(1:10)),'bo-',...
	    1:10,imag(V(1:10)),'r-x');grid on;
xlabel('?');ylabel('?');
figure;plot(4087:4096,real(V(4087:4096)),'b-o',...
	    4087:4096,imag(V(4087:4096)),'r-x');
grid on;
xlabel('?');ylabel('?');
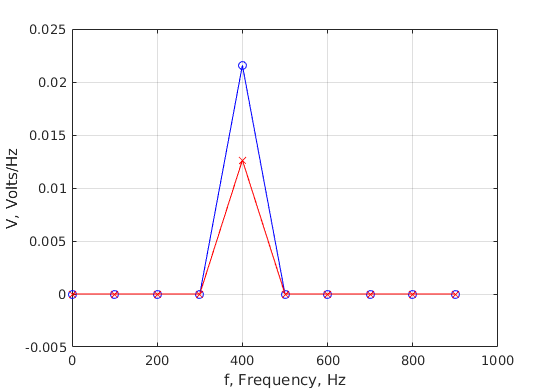
Use a frequency axis and scale the voltage
V=V/4096*max(t);
f=fftaxis(t); % needs fftaxis.m by Chuck DiMarzio
% Plot the first and last 10 points
figure;plot(f(1:10),real(V(1:10)),'bo-',...
	    f(1:10),imag(V(1:10)),'r-x');grid on;
xlabel('f, Frequency, Hz');ylabel('V, Volts/Hz');
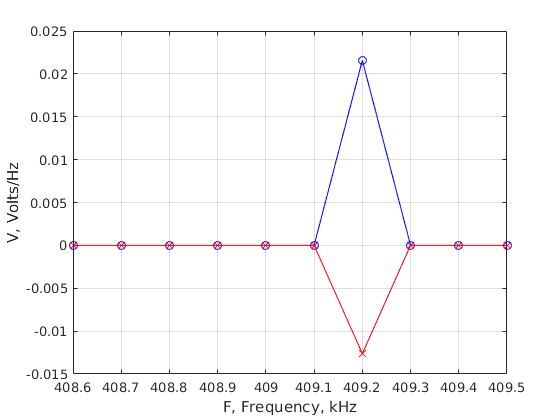
figure;plot(f(4087:4096)/1000,real(V(4087:4096)),'b-o',...
	    f(4087:4096)/1000,imag(V(4087:4096)),'r-x');
grid on;
xlabel('F, Frequency, kHz');ylabel('V, Volts/Hz');
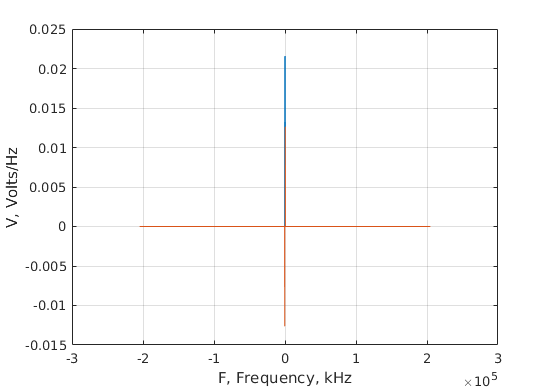
Deal with the periodicity of the FFT
f=fftaxisshift(f); % needs fftaxisshift.m by Chuck DiMarzio
V=fftshift(V); % Existing function in matlab
figure;plot(f,real(V),f,imag(V));grid on;
xlabel('F, Frequency, kHz');ylabel('V, Volts/Hz');
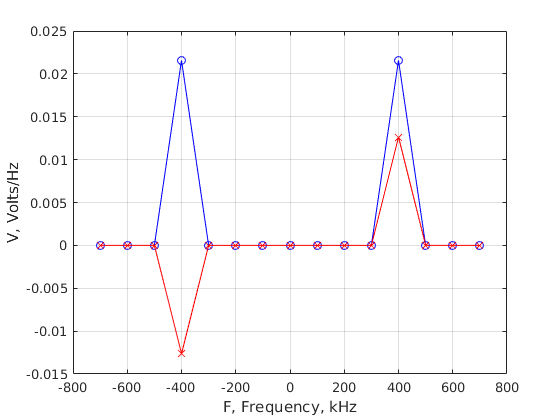
%Plot the interesting region
test=find(abs(f)<2*f0);
figure;plot(f(test),real(V(test)),'b-o',...
	    f(test),imag(V(test)),'r-x');grid on;
xlabel('F, Frequency, kHz');ylabel('V, Volts/Hz');
% What is the amplitude?
% There are only 2 points, so inverse FT is quite easy.  Multiply
% by df and exp(1j*2*pi*f*t) where f = +/- f0.
Vmax=max(abs(V))
Vmax =
    0.0250
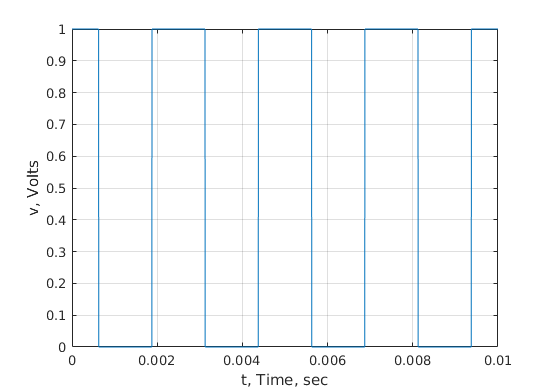
Now let's do a square wave with DC bias
vm=5;phi=0*pi/180;v=double(vm*cos(omega0*t+phi)>0);
figure;plot(t,v);grid on;
xlabel('t, Time, sec');ylabel('v, Volts');
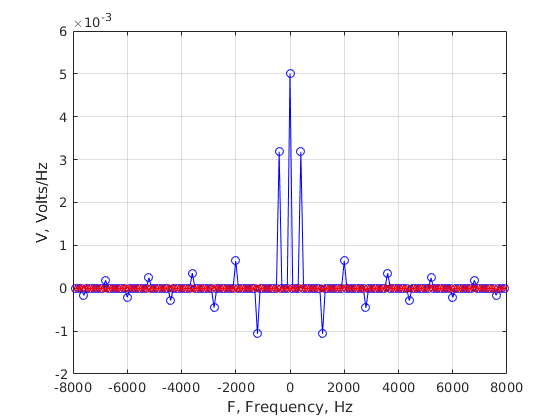
%  Fourier transform
V=fftshift(fft(v)/4096*max(t));
test=find(abs(f)<20*f0);
figure;plot(f(test),real(V(test)),'b-o',...
	    f(test),imag(V(test)),'r-x');grid on;
xlabel('F, Frequency, Hz');ylabel('V, Volts/Hz');
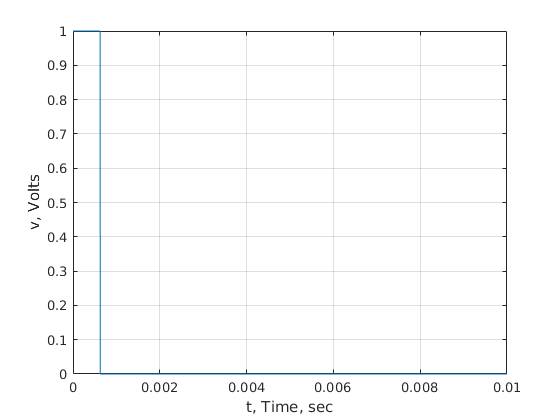
Now a pulse
v=zeros(size(t));
v(1:256)=1;
figure;plot(t,v);grid on;
xlabel('t, Time, sec');ylabel('v, Volts');
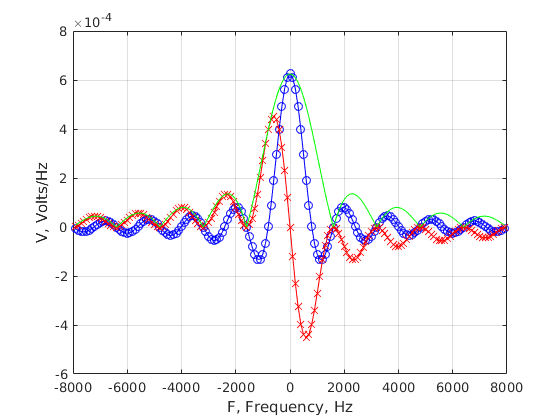
%  Fourier transform
V=fftshift(fft(v)/4096*max(t));
test=find(abs(f)<20*f0);
figure;plot(f(test),real(V(test)),'b-o',...
	    f(test),imag(V(test)),'r-x',...
	    f(test), abs(V(test)),'g-');grid on;
xlabel('F, Frequency, Hz');ylabel('V, Volts/Hz');
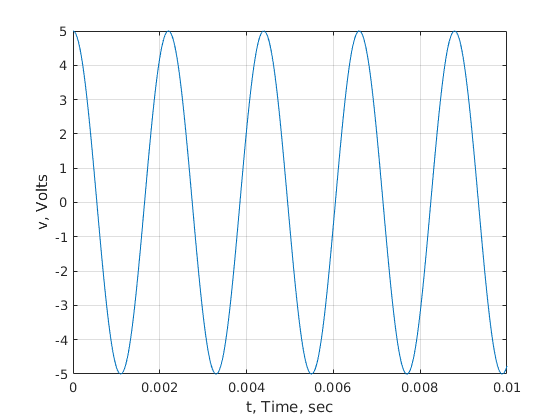
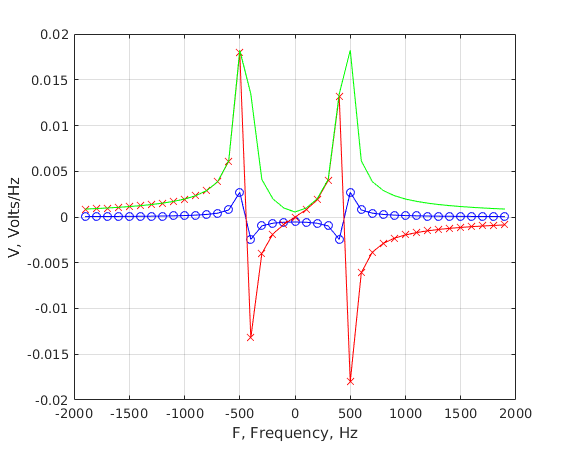
OK. time for an interesting sinusoid
Don't try to understand this until you know about convolution
T1=900.354*10e-3/4096; % Not a power of 2
f1=1/T1
omega1=2*pi*f1;
vm1=5;phi1=0*pi/180;v=vm1*cos(omega1*t+phi1);
figure;plot(t,v);grid on;
xlabel('t, Time, sec');ylabel('v, Volts');
%  Fourier transform
V=fftshift(fft(v)/4096*max(t));
test=find(abs(f)<5*f0);
figure;plot(f(test),real(V(test)),'b-o',...
	    f(test),imag(V(test)),'r-x',...
	    f(test), abs(V(test)),'g-');grid on;
xlabel('F, Frequency, Hz');ylabel('V, Volts/Hz');
f1 =
  454.9322
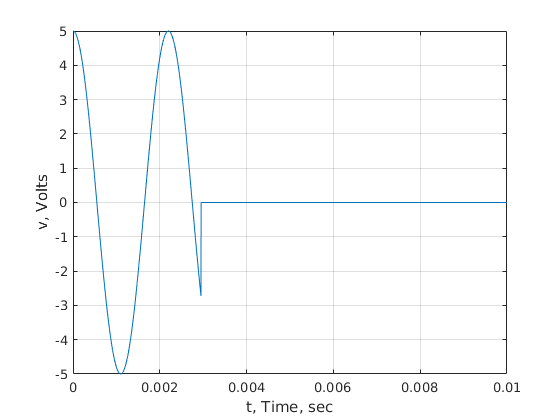
Truncate the sine wave
vt=v;
vt(find(t>2.95e-3))=0;
figure;plot(t,vt);grid on;
xlabel('t, Time, sec');ylabel('v, Volts');
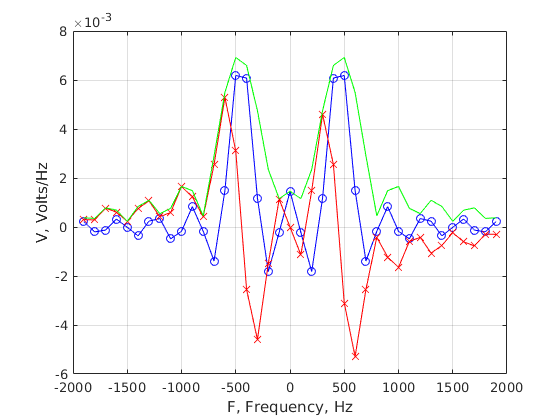
%  Fourier transform
Vt=fftshift(fft(vt)/4096*max(t));
test=find(abs(f)<5*f0);
figure;plot(f(test),real(Vt(test)),'b-o',...
	    f(test),imag(Vt(test)),'r-x',...
	    f(test), abs(Vt(test)),'g-');grid on;
xlabel('F, Frequency, Hz');ylabel('V, Volts/Hz');

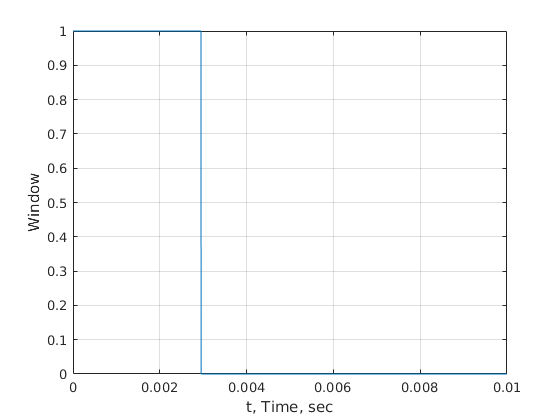
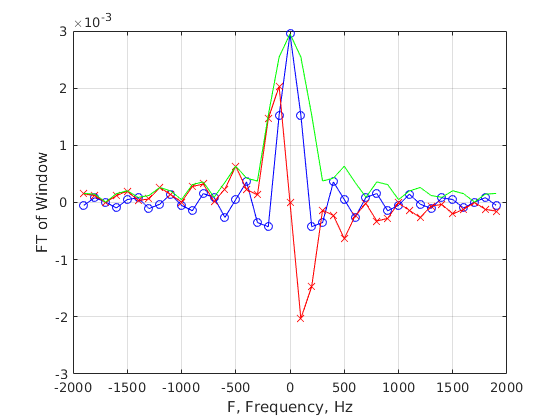
% Compare the Fourier Transform of a "time window"
w=ones(size(t));
w(find(t>2.95e-3))=0;
figure;plot(t,w);grid on;
xlabel('t, Time, sec');ylabel('Window');
%  Fourier transform
W=fftshift(fft(w)/4096*max(t));
test=find(abs(f)<5*f0);
figure;plot(f(test),real(W(test)),'b-o',...
	    f(test),imag(W(test)),'r-x',...
	    f(test), abs(W(test)),'g-');grid on;
xlabel('F, Frequency, Hz');ylabel('FT of Window');
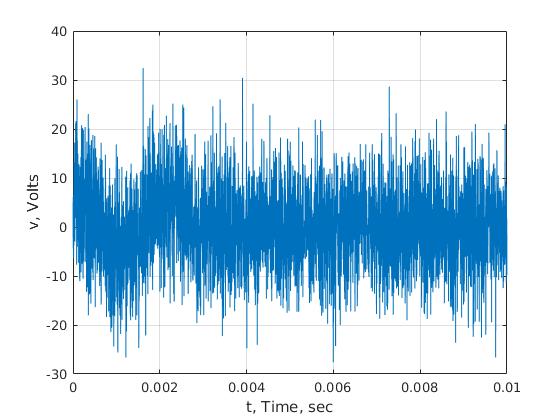
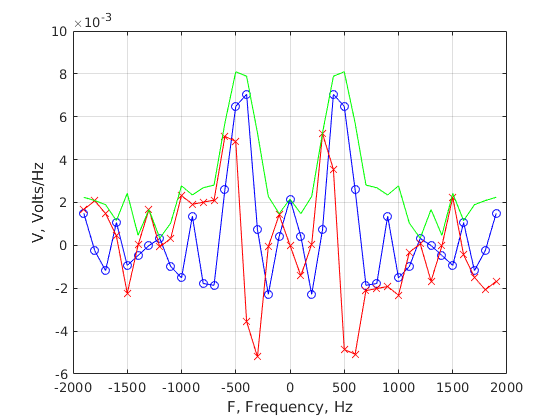
Now. let's add some noise
vn=vt+randn(size(t))*8;
figure;plot(t,vn);grid on;
xlabel('t, Time, sec');ylabel('v, Volts');
%  Fourier transform
Vn=fftshift(fft(vn)/4096*max(t));
test=find(abs(f)<5*f0);
figure;plot(f(test),real(Vn(test)),'b-o',...
	    f(test),imag(Vn(test)),'r-x',...
	    f(test), abs(Vn(test)),'g-');grid on;
xlabel('F, Frequency, Hz');ylabel('V, Volts/Hz');

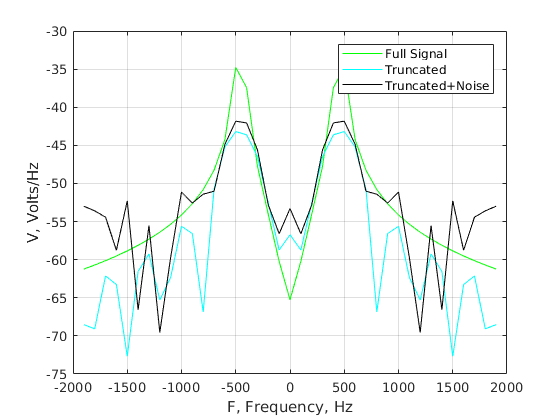
figure;plot(f(test),20*log10(abs(V(test))),'g-',...
	    f(test),20*log10(abs(Vt(test))),'c-',...
	    f(test),20*log10(abs(Vn(test))),'k-');grid on;
xlabel('F, Frequency, Hz');ylabel('V, Volts/Hz');
legend('Full Signal','Truncated','Truncated+Noise');

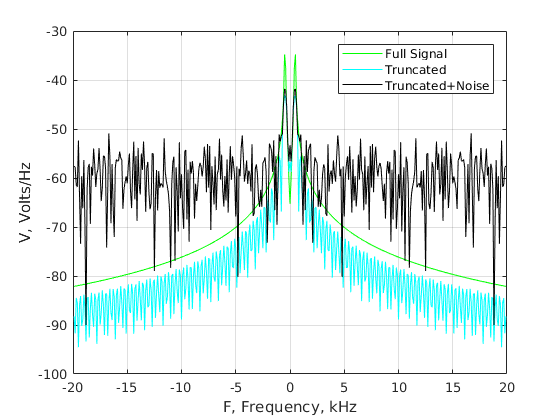
% Do it in dB over a wider band
test=find(abs(f)<50*f0);
figure;plot(f(test)/1000,20*log10(abs(V(test))),'g-',...
	    f(test)/1000,20*log10(abs(Vt(test))),'c-',...
	    f(test)/1000,20*log10(abs(Vn(test))),'k-');grid on;
xlabel('F, Frequency, kHz');ylabel('V, Volts/Hz');
legend('Full Signal','Truncated','Truncated+Noise');
