Contents
% /home/dimarzio/Documents/working/12229/lectures/alias.m
% Sat Nov 11 14:19:11 2017
% Chuck DiMarzio, Northeastern University
Setup
npts1=2^16;
npts=2^4;
t=[0:npts-1]*10e-3/npts;  % Time axis
% Sampling Frequency
dt=t(2)-t(1)
fsample=1/dt
dt =
   6.2500e-04
fsample =
        1600
Generate the signal
Start with two sinusoidal waves
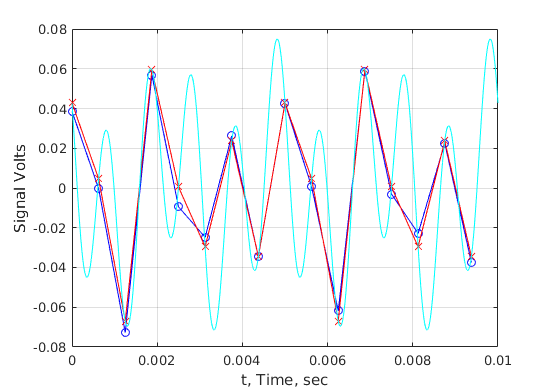
f1=400;
omega1=2*pi*f1;
f2=1000;
omega2=2*pi*f2;
vm1=0.025;phi1=30*pi/180;v1=vm1*cos(omega1*t+phi1);
vm2=0.05;phi2=65*pi/180;v2=vm2*cos(omega2*t+phi2);
vsignal=v1+v2;
% Add some random noise
vn=0.005;vnoise=randn(size(t))*vn; % Smaller than fftclass.m
% Why so little noise?   Smaller number of points in the FT.
v=vsignal+vnoise;
th=[1:npts1]*10e-3/npts1;  % Time axis for high sample rate
vh1=vm1*cos(omega1*th+phi1);
vh2=vm2*cos(omega2*th+phi2);
vhighsample=vh1+vh2;
Plot vs. time
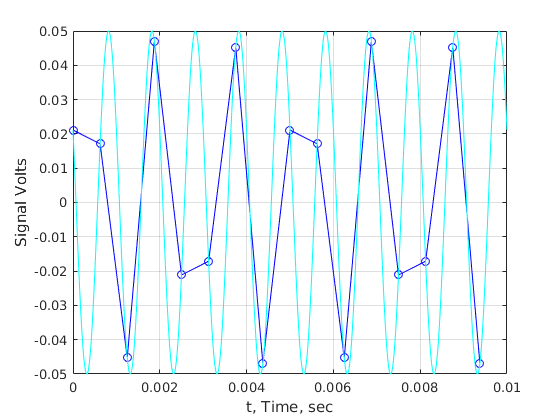
figure;plot(t,v,'-bo',t,vsignal,'r-x',th,vhighsample,'c');grid on;
xlabel('t, Time, sec');ylabel('Signal Volts');
% Just the high frequency term
figure;plot(t,v2,'-bo',th,vh2,'c');grid on;
xlabel('t, Time, sec');ylabel('Signal Volts');
% Note that we missed four cycles out of 10.  Not surprising if we
% see this 1000Hz signal at 600Hz in the Fourier Transform.
Fourier transform
Vsignal=fftshift(fft(vsignal)/npts*max(t));
V=fftshift(fft(v)/npts*max(t));
f=fftaxisshift(fftaxis(t)); % needs 2 functions from Chuck DiMarzio
plot the spectra
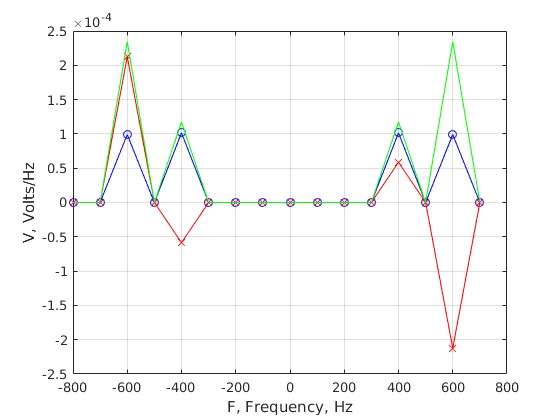
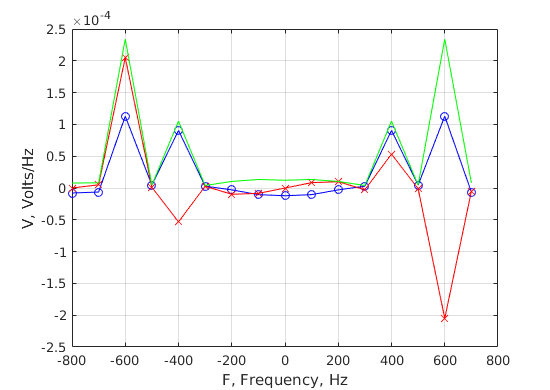
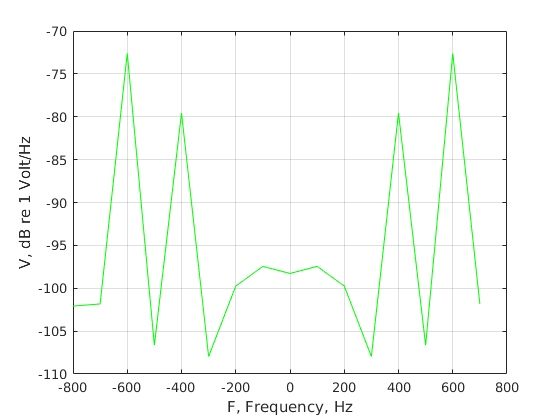
test=find(abs(f)<5*max(f1,f2));
% Noise-free signal
figure;plot(f(test),real(Vsignal(test)),'b-o',...
	    f(test),imag(Vsignal(test)),'r-x',...
	    f(test),abs(Vsignal(test)),'g-');grid on;
xlabel('F, Frequency, Hz');ylabel('V, Volts/Hz');
% Total with noise
figure;plot(f(test),real(V(test)),'b-o',...
	    f(test),imag(V(test)),'r-x',...
	    f(test),abs(V(test)),'g-');grid on;
xlabel('F, Frequency, Hz');ylabel('V, Volts/Hz');

% Plot in dB on a wider frequency scale
test=find(abs(f)<20*max(f1,f2));
figure;plot(f(test),20*log10(abs(V(test))),'g-');grid on;
xlabel('F, Frequency, Hz');ylabel('V, dB re 1 Volt/Hz');
Look at the measurements of the first signal
df=1/max(t);
signalamplitude=[vm1,vm2]
signalphase=[phi1,phi2]*180/pi
fpk=find((abs(f)==f1)|(abs(f)==f2));
freqency=f(fpk)
measuredamplitude=abs(V(fpk))*df
measuredphase=angle(V(fpk))*180/pi
signalamplitude =
    0.0250    0.0500
signalphase =
   30.0000   65.0000
freqency =
  -400   400
measuredamplitude =
    0.0112    0.0112
measuredphase =
  -30.4785   30.4785